Project Summary
Budget
Up to 190.12 billion yen
CO2 Reduction Effect (World)
- In 2030
- 1,275.6 million tons/year
- In 2050
- 8,919.0 million tons/year
Economic Effect (World)
- In 2030
- Approximately 89.0 trillion yen
- In 2050
- Approximately 358.0 trillion yen
Research and Development Targets
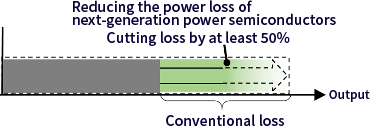
- Using next-generation power semiconductors, reduce the level of energy loss in power converters by at least 50%, and, during mass production, realize similar cost levels to those of Si power semiconductors.

- Reduce defect density in 8-inch (200mm) SiC wafers by at least one order of magnitude and reduce costs.
- Realize energy efficiency of at least 40% compared to data centers in use when R&D begins.

- Reduce overall system power consumption by 40% by developing edge computing technology for devices
Assumptions regarding estimates of CO2 reduction effect
Power semiconductors
Electric vehicles
- Estimates of annual CO2 emissions per vehicle calculated on basis of electric vehicles CO2 emissions and average driving distances for vehicles in Japan.
- Dissemination rate of electric vehicles is expected to be 50% in 2030 and 100% in 2050.
- Electric vehicles energy loss ratio is expected to be 20% and impact of cutting loss through outcomes realized by this project is expected to be 50%.
Electric power generation (e.g., by renewable energy)
- Energy loss in power converters used for transmission is expected to be reduced through utilizing offshore wind power as a substitute for thermal power.
- Capacity of offshore wind power installations in Japan is expected to range from 1.68 GW to 3.68 GW in 2030 and total 45 GW by 2050, and global capacity is expected to reach 234 GW in 2030 and 1,400 GW in 2050.
- Regarding the facility utilization rate of 33.2% and the average electric power emission coefficient of thermal power of 0.66 kg-CO2/kWh, these figures were used for the GI project “Cost Reductions for Offshore Wind Power Generation.”
- Energy loss in conventional semiconductor converters is currently 2% and the impact of cutting loss as result of project outcomes is expected to be 50%.
Server power sources
- Considering the rate of increase in power consumption by data centers around the world since 2019, power consumption in 2030 and 2050 is estimated below.
Table: Power consumption by data centers within and outside Japan (TWh) 2019 2030 2050 Japan 14 18 43 World 200 252 612 - Power sources are expected to account for 25% of energy consumption and the impact of reducing loss through project outcomes is expected to be 50%.
Next-generation green data centers
- Energy efficiency of 40% are expected to be realized by data centers and the dissemination rate of energy efficiency technologies is expected to be 40% in 2030 and 100% in 2050.
- CO2 emissions are expected to be reduced through power generation cuts made possible by energy efficiency activities.
IoT sensing platforms
- Various research reports predict that M2M demand will increase and reach 125 billion units by 2030
- According to a DBJ report, the number of M2M sensors installed is approximately 14%. Based on this data, the number of sensors is projected to increase from 63 million units in 2020 to 740 million units by 2030, reaching 6 billion units by 2050
- Estimated when applying the signal processing technology developed in this project to “4K images + existing compression technology”
Assumptions regarding estimates of economic effect
Power semiconductors
- For 2050, the estimated market size has been calculated on the assumption that, using the compound annual growth rate (CAGR), the global power semiconductor market totaled approximately 3.2 trillion yen in 2020 and will total 5 trillion yen in 2030.
- For 2050, the estimated market size has been calculated on the assumption that the average CAGR up to 2050 will be approximately 10%.
Next-generation green data centers
- In 2019, global investment in data centers totaled US$214.9 billion and Japanese investment totaled US$12.1 billion. By 2025, it is estimated that global investment will grow to US$271.6 billion (at a CAGR of 4%) and Japanese investment will grow to US$13.2 billion (at a CAGR of 1.5%).
- Estimates based on assumption that global investment will continue to grow at a CAGR of 4% and Japanese investment will also continue increasing at a CAGR of 1.5%.
IoT sensing platforms
- Calculated based on the future prediction of the number of sensors, assuming the unit price of the sensor and the usage fee for maintaining the platform service
- The number of sensors is calculated assuming a CAGR of 20%
- The unit price of the sensor is assumed to be 10,000 yen based on the unit price of commercially-available intelligent sensors equipped with AI functions. The usage fee for the platform service is assumed to be the average price of a subscription service : 2,000 yen